NCAA Changes in Participation, Squad Sizes, & Teams

For a listing of all participation statistics, by division and overall, male and female, and by sport, contact the NCAA.

NCAA Participation Reports: All Divisions
Contents:


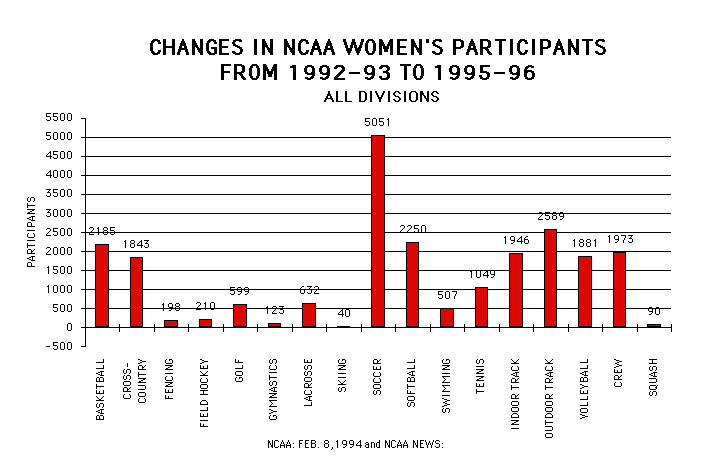
The following graphs are based on NCAA Annual Participation Reports from 1992-93 to 1995-96, and 1994-95 to 1995-96.
Participation Numbers

Changes in NCAA Women's Participants From 1992-93 to 1995-96 is displayed as agraphic.  To view it, please download excel or pdf document

Download options: PDF File; Excel chart.
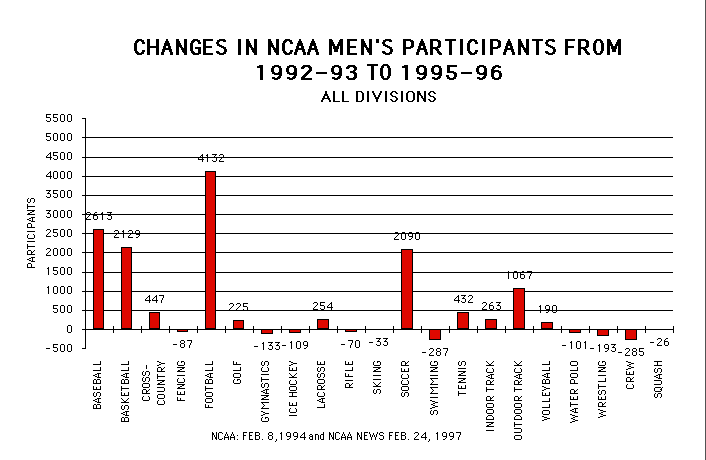

Changes in NCAA Men's Participants From 1992-93 to 1995-96 is displayed as agraphic.  To view it, please download excel or pdf document

Download options: PDF File; Excel chart.
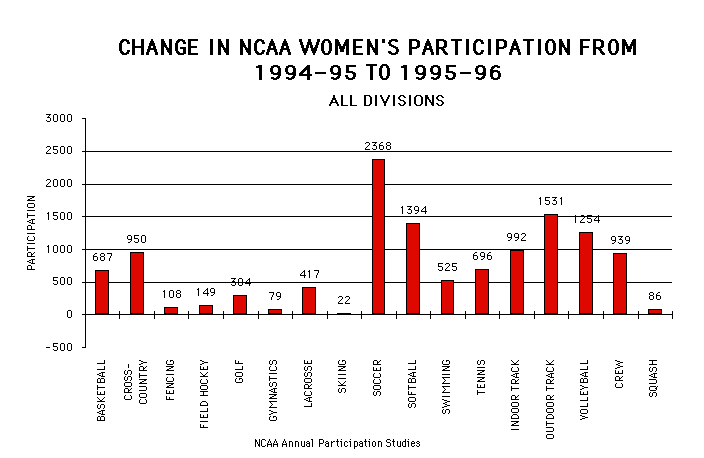

Changes in NCAA Women's Participants From 1994-95 to 1995-96 is displayed as agraphic.  To view it, please download excel or pdf document

Download options: PDF File; Excel chart.
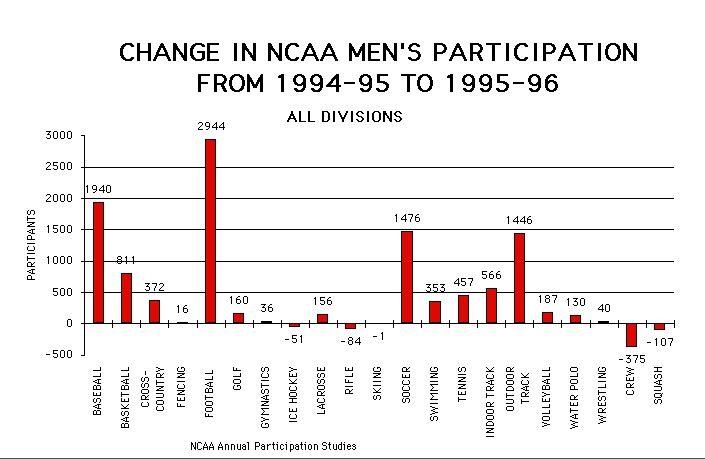

Changes in NCAA Men's Participants From 1994-95 to 1995-96 is displayed as agraphic.  To view it, please download excel or pdf document

Download options: PDF File; Excel chart.

Squad Numbers

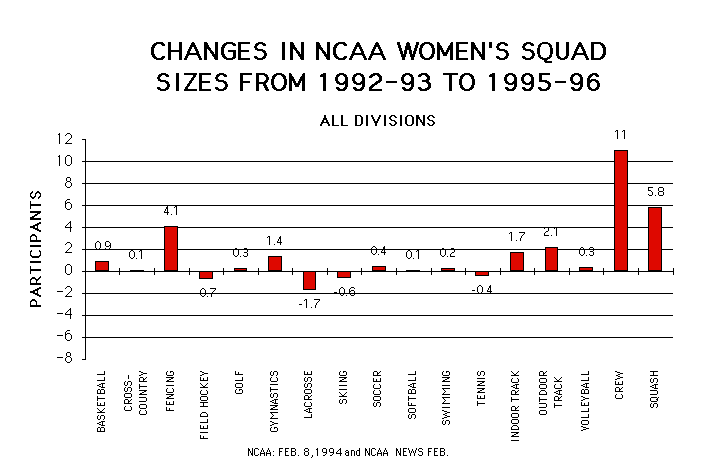
Changes in NCAA Women's Squad Sizes From 1992-93 to 1995-96 is displayed as agraphic.  To view it, please download excel or pdf document

Download options: PDF File; Excel chart.
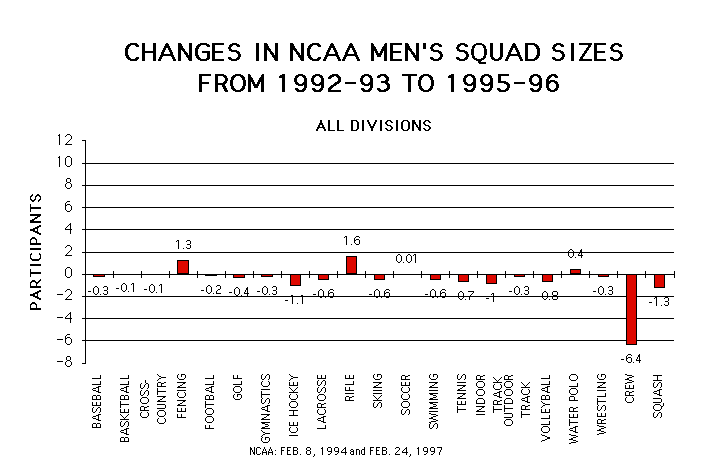

Changes in NCAA Men's Squad Sizes From 1992-93 to 1995-96 is displayed as agraphic.  To view it, please download excel or pdf document

Download options: PDF File; Excel chart.
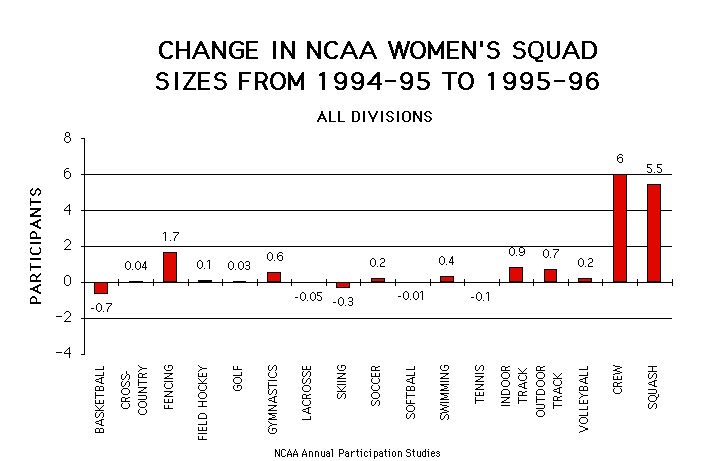

Changes in NCAA Women's Squad Sizes From 1994-95 to 1995-96 is displayed as agraphic.  To view it, please download excel or pdf document

Download options: PDF File; Excel chart.
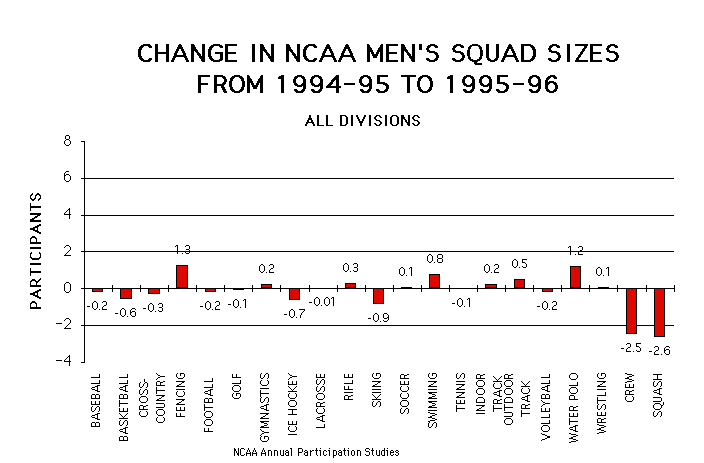

Changes in NCAA Men's Squad Sizes From 1994-95 to 1995-96 is displayed as agraphic.  To view it, please download excel or pdf document

Download options: PDF File; Excel chart.

Teams

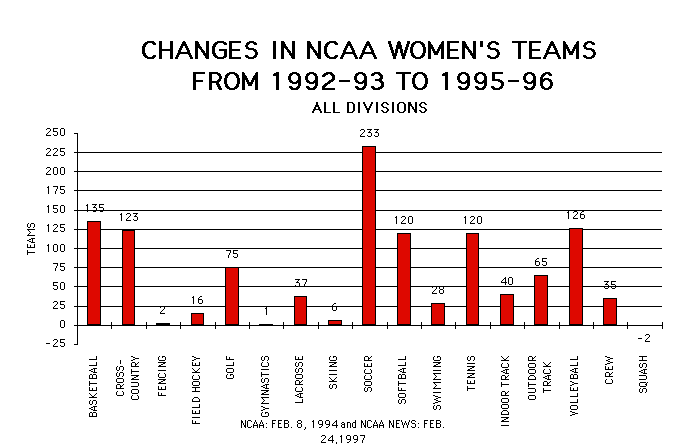
Changes in NCAA Women's Teams From 1992-93 to 1995-96 is displayed as agraphic.  To view it, please download excel or pdf document

Download options: PDF File; Excel chart.
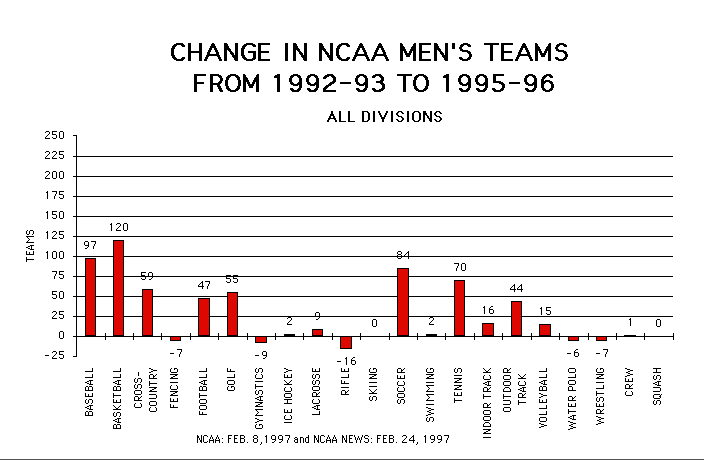

Changes in NCAA Men's Teams From 1992-93 to 1995-96 is displayed as agraphic.  To view it, please download excel or pdf document

Download options: PDF File; Excel chart.
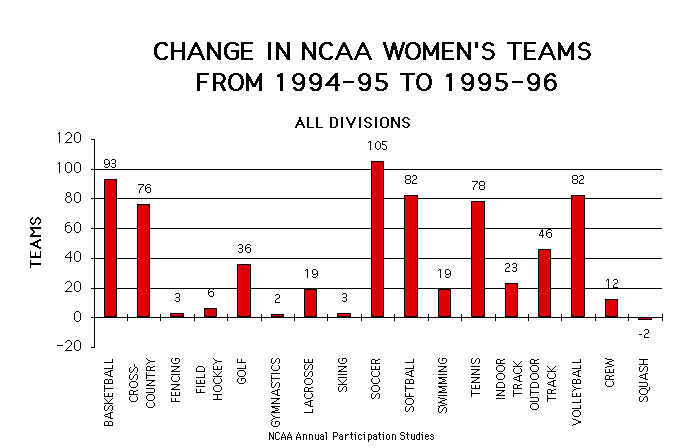

Changes in NCAA Women's Teams From 1994-95 to 1995-96 is displayed as agraphic.  To view it, please download excel or pdf document

Download options: PDF File; Excel chart.
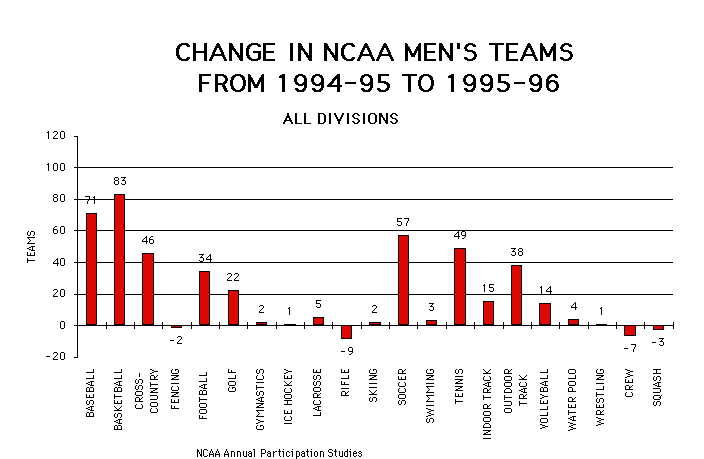

Changes in NCAA Men's Teams From 1994-95 to 1995-96 is displayed as agraphic.  To view it, please download excel or pdf document

Download options: PDF File; Excel chart.


Return to Main Menu or to Top of Page


Participation Reports: All Divisions

The following tables are based on NCAA Annual Participation Reports.
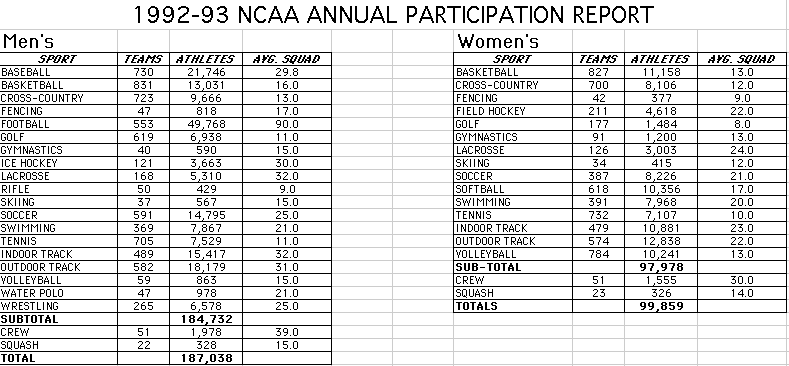
1992-93 NCAA Annual Participation Report is displayed as a graphic.  To view it, please download excel or pdf document.

Donwload options: PDF File; Excel table.
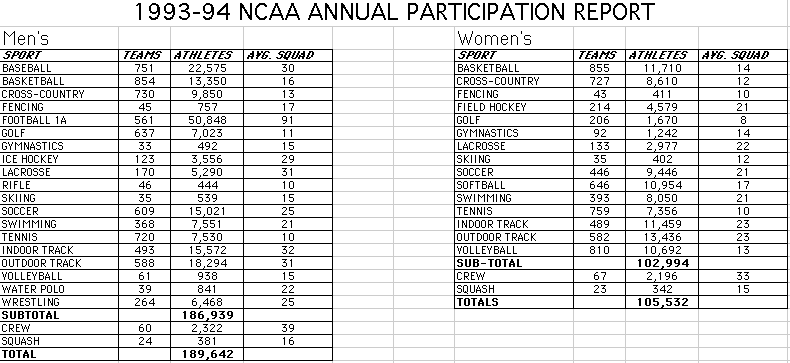

1993-94 NCAA Annual Participation Report is displayed as a graphic.  To view it, please download excel or pdf document.

Donwload options: PDF File; Excel table.
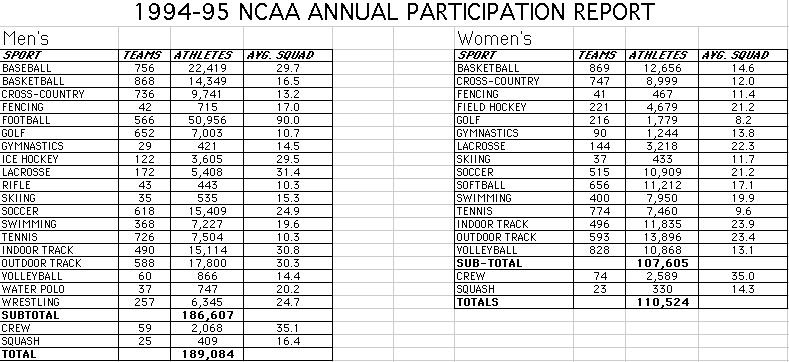

1994-95 NCAA Annual Participation Report is displayed as a graphic.  To view it, please download excel or pdf document.

Donwload options: PDF File; Excel table.
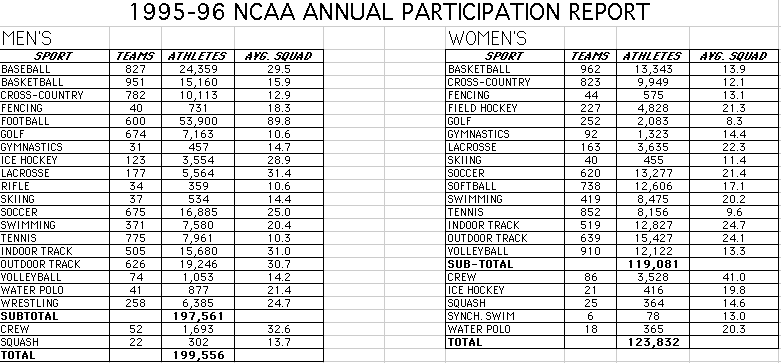

1995-96 NCAA Annual Participation Report is displayed as a graphic.  To view it, please download excel or pdf document.

Donwload options: PDF File; Excel table.


Return to Main Menu or to Top of Page